
Most WordPress database optimization advice starts with a button: delete revisions, clear transients, optimize tables, and hope the site feels faster. That approach confuses less stored data with less work per request. A smaller database can still serve slow queries, load an oversized options payload, wait on uncached PHP, or trigger a remote API call that has nothing to do with table size.
A better approach treats the database as part of a request path. Measure what anonymous visitors, logged-in users, search, REST requests, cron jobs, and checkout execute. Then change one thing, repeat the same test, and keep the change only if the workload improves without creating a write-side problem.
Table of Contents
- Why Pressing Optimize Is Rarely the Answer
- Setting Up Measurement Before You Touch a Row
- Reading Slow Queries and Indexing for Real Workloads
- Auditing Autoloaded Options Without Breaking the Site
- When Cleanup Actually Helps and When It Does Not
- Configuring WP-Optimize Without Schedule Theater
- Validating Changes With Cold-Cache and Concurrency Tests
Why Pressing Optimize Is Rarely the Answer
A one-click optimization plugin can remove old rows, but it can't tell you whether those rows caused the delay. WordPress may be slow because a theme runs wasteful queries, a plugin performs an unindexed lookup, PHP waits for an external service, or the server lacks an effective caching layer. Deleting revisions won't repair any of those paths.
The database still matters. WordPress stores revisions in the main posts table as records with the post type revision and status inherit, rather than placing them in a separate revisions table. Frequent editorial saves or automated workflows can therefore increase the size and workload of the same table used for ordinary posts and pages, as documented in the WordPress revisions documentation.

Practical rule: A cleanup is successful only when it improves a measured workload, not when a plugin displays a smaller table or a green completion badge.
What cleanup can and cannot fix
Cleanup is useful when accumulated records contribute to scans, joins, storage pressure, or request-time option loading. It isn't a substitute for profiling. The distinction matters because WordPress's own performance guidance separates database cleanup from persistent object caching. Object caching reduces repeated trips between the web server and database, while revision limits and autoload control address different sources of work, as explained in the WordPress performance optimization guidance.
The workflow is straightforward:
- Measure first: Capture cached and uncached TTFB, SQL time, query count, and the slowest request paths.
- Find ownership: Identify the plugin, theme, or workflow responsible for expensive data and queries.
- Change one variable: Clean rows, alter autoload behavior, or add an index, but don't combine unrelated changes.
- Validate under the same workload: Keep the cache state, dataset, concurrency, and server conditions consistent.
That method prevents schedule theater. You don't maintain a database because a calendar says it is cleanup day. You maintain it when evidence shows that accumulated data is contributing to latency, lock waits, storage pressure, or operational risk.
Setting Up Measurement Before You Touch a Row
A smaller database is not a performance result. Start by identifying the requests that expose database work, including the homepage, an archive, internal search, a product or content detail page, and any authenticated or transactional flow that matters. Anonymous cached pages can look fast while logged-in requests, cache misses, REST calls, cron jobs, and search continue to run expensive queries.
Run each important path with a cold-cache request and a warm-cache request. Cold cache reveals response-generation cost without a primed page cache. Warm cache shows the experience for repeat anonymous visitors. Record p50 and p95 TTFB, total SQL time, query count, autoload bytes, PHP memory, and relevant errors. The independent WordPress database optimization guide from PageSpeed Matters also separates cache effects from database behavior when comparing conditions before and after a change.
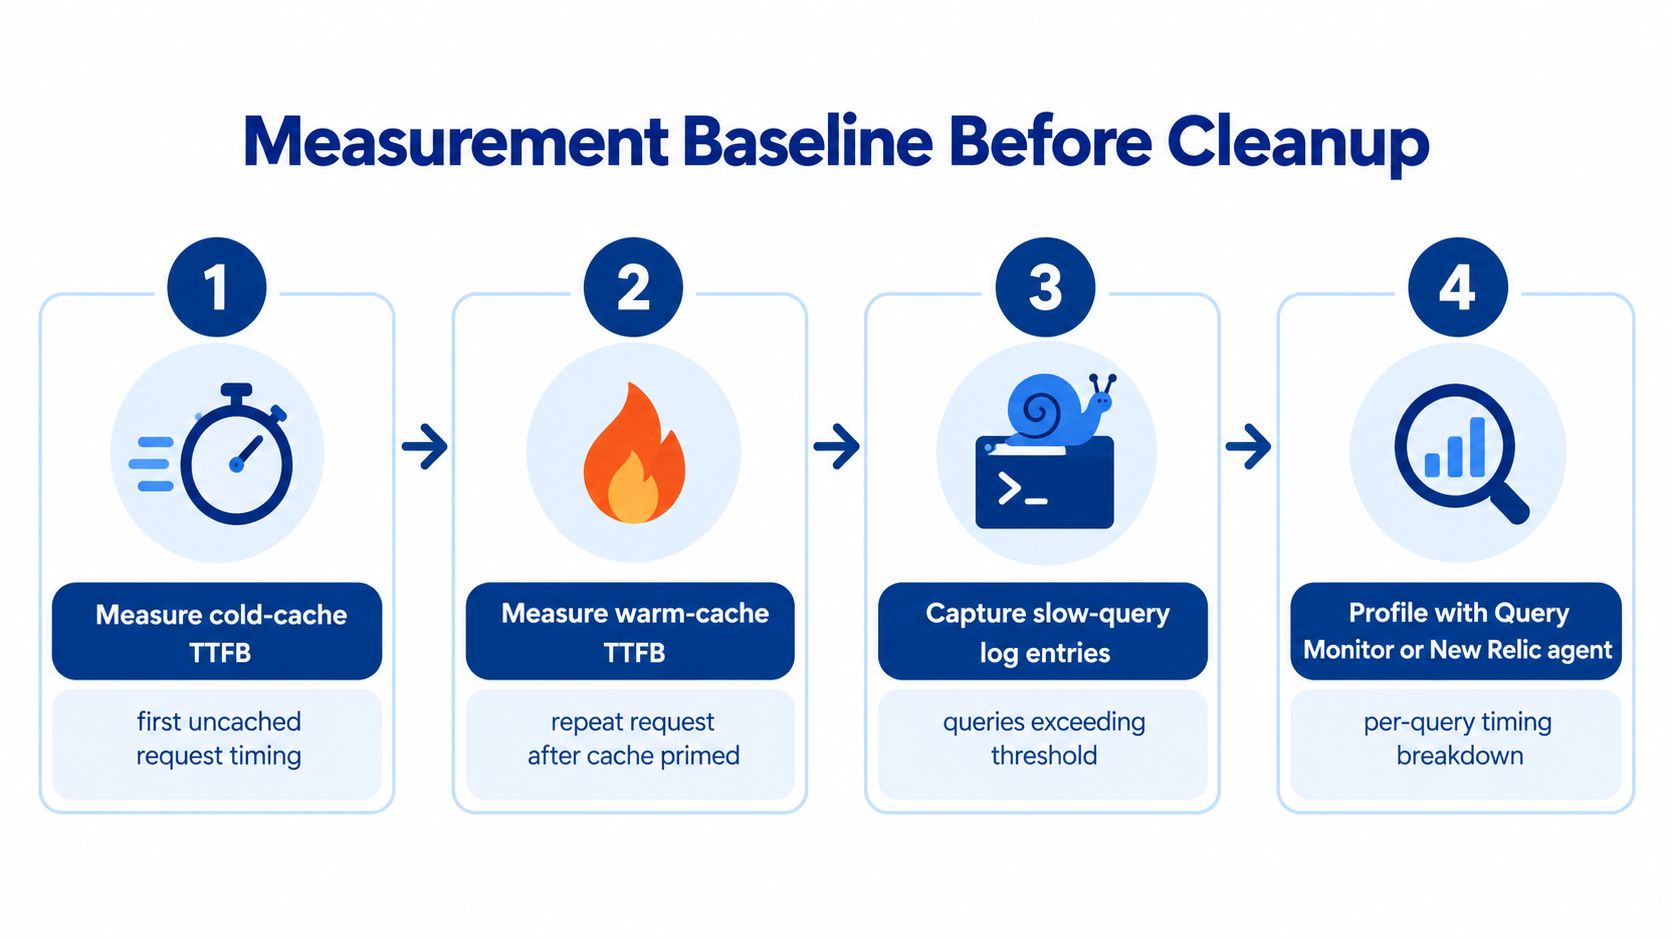
Use Query Monitor on staging or in a protected production session to connect slow queries with plugins, themes, and components. Add a New Relic PHP agent when historical traces or production sampling are needed. Database slow-query logging completes the picture by showing SQL execution alongside the WordPress caller.
Keep each test comparable. Note the request type, cache state, object-cache state, MySQL or MariaDB version, dataset, and recent schema changes. Record p50 and p95 TTFB, SQL duration, query count, memory use, write latency, lock waits, errors, and background-task behavior.
The surrounding site architecture also affects interpretation. Document the database path alongside the broader setup in this guide to high-converting digital hubs, since PHP execution, caching, and page generation can mask or amplify database work.
The video below provides additional visual context for the measurement process.
Before changing a row, answer this: which request is slow, and what database work does it perform? That answer determines whether the next step is query analysis, autoload ownership mapping, indexing, or cleanup.
Reading Slow Queries and Indexing for Real Workloads
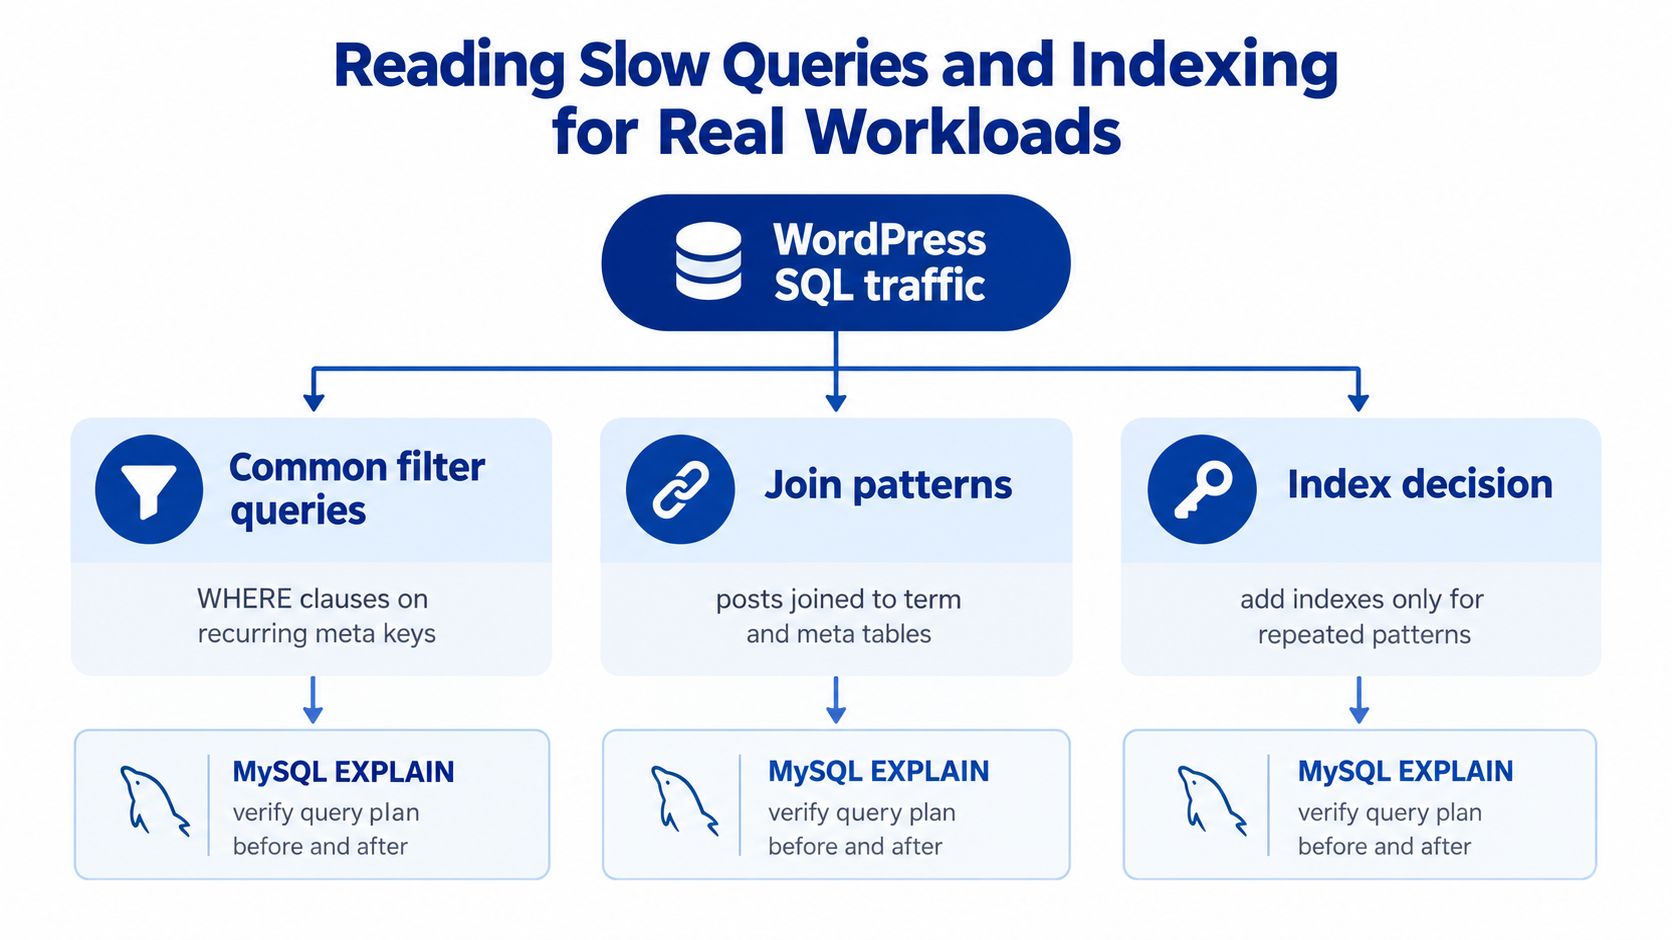
A slow WordPress query is a diagnostic clue, not an invitation to add indexes everywhere. Start with SQL captured from a real page, search request, checkout flow, or background task. Run MySQL EXPLAIN, then inspect the access type, selected key, estimated rows, join order, and extra operations. The goal is to identify the work the request performs.
Prioritize repeated access to wp_options, wp_postmeta, taxonomy relationships, and plugin-created tables. Their presence does not prove an index is missing. MySQL's select optimization documentation describes using EXPLAIN to assess index usage, limiting unnecessary full-table scans, and refreshing optimizer statistics with ANALYZE TABLE when appropriate.
Let the workload choose the index
Consider a recurring wp_postmeta query that filters on meta_key before joining through post_id. Its useful index may differ from a query that begins with post_id. Predicate order, selectivity, and join conditions decide whether a composite index improves the plan. A copied forum recommendation can enlarge the schema while leaving the slow request untouched.
Use a short evidence chain:
- Capture the actual SQL: Record the query generated by the affected request or task, including its parameters where possible.
- Run
EXPLAIN: Check the chosen key, access type, estimated rows, join order, and extra operations. - Refresh statistics when justified: Run
ANALYZE TABLEif statistics may be stale, then compare the resulting plan. - Design for repeated predicates: Match the index to filters and joins used by the workload, rather than to a table name.
- Measure the write cost: Test reads alongside inserts, updates, deletes, lock waits, and buffer-pool pressure.
An index is a schema change, not a performance result. Keep it only when the target request gains lower p95 latency without an unacceptable write penalty.
Over-indexing adds storage and maintenance work. MySQL must update every affected index during INSERT, UPDATE, and DELETE operations. That trade-off matters on editorial sites, stores, membership systems, and other installations with frequent writes. Cached public pages may hide the cost, while logged-in users, search, and checkout still execute the underlying queries.
Database compatibility belongs in the same review. WordPress stores its database-structure version in the db_version option, and its documented history includes schema and compatibility changes, including the WordPress 2.9 database version milestone. The WordPress glossary documentation helps define the application, schema, engine, and server terms involved. Test migrations on staging, back up before changes, and inspect the query plan afterward.
For server-side context, compare database findings with these configuration tips for modern server-side speed. A sound query plan cannot offset an application stack configured to add avoidable PHP, cache, or database work.
Auditing Autoloaded Options Without Breaking the Site
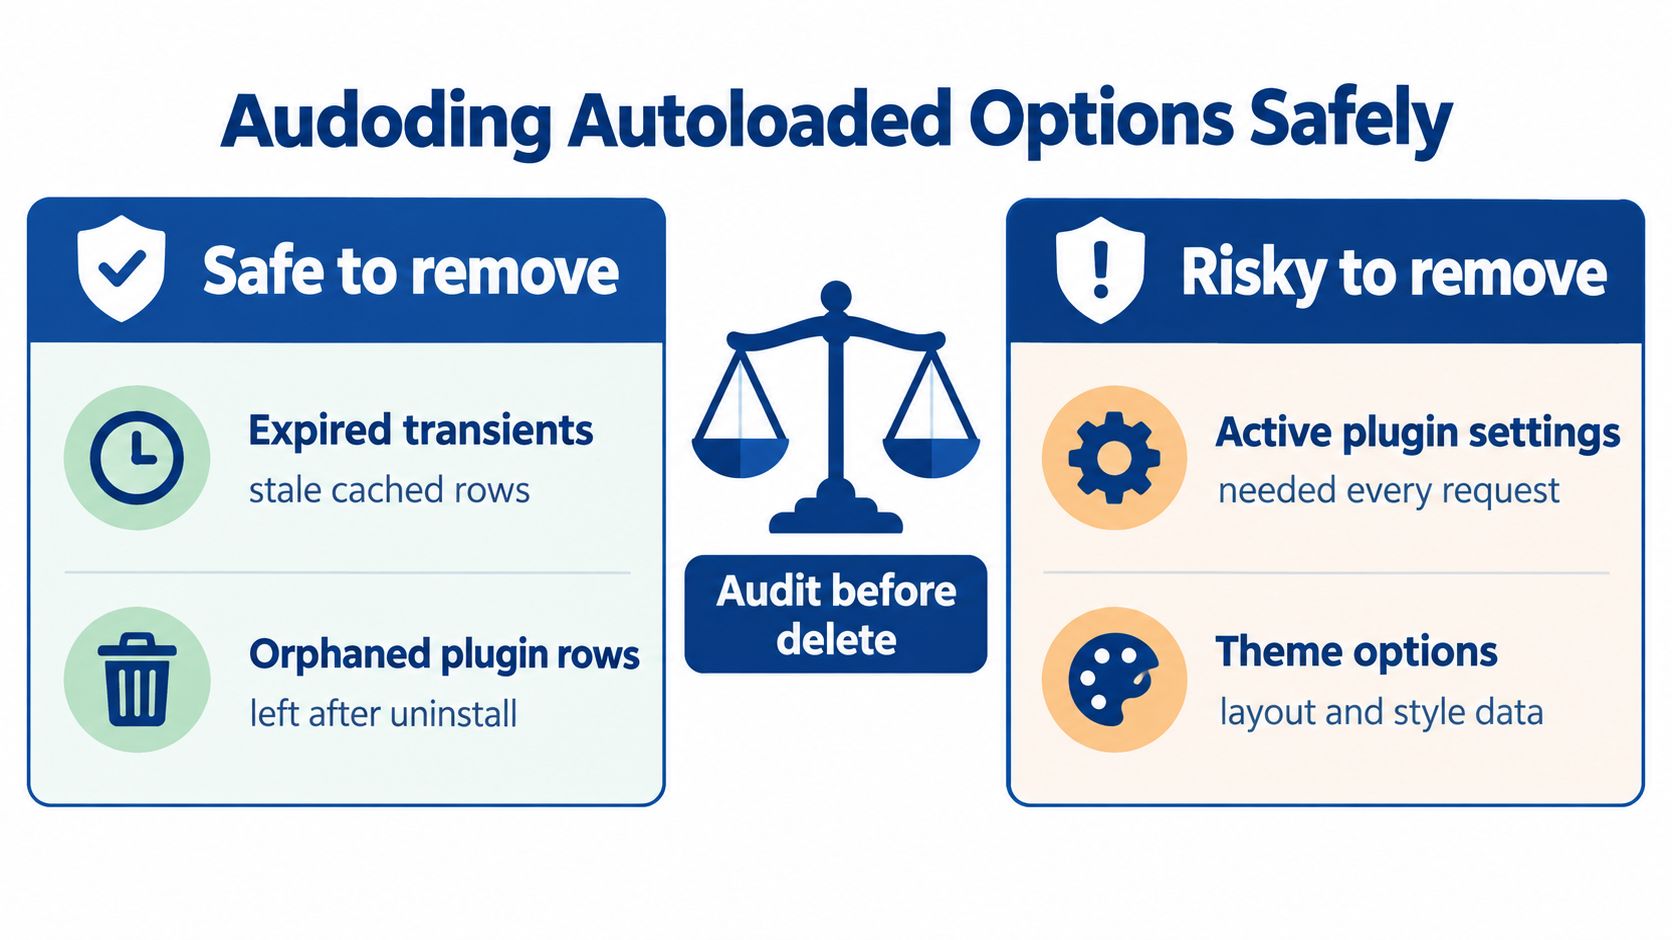
Autoloaded options deserve a separate audit because WordPress can load them on every request. The difficult part isn't finding a large value. It's deciding whether that value belongs in the bootstrap path, who owns it, and what breaks when you stop loading it automatically.
Begin with an inventory of wp_options. Group entries by autoload status, serialized size, option name, and owning plugin or theme. Then classify each entry by request path. A front-end setting needed for every page is different from an admin-only report, a cron cache, or a REST-specific configuration value.
The WordPress reference for wp_set_option_autoload_values describes the more granular autoload behavior introduced in WordPress 6.6 and the shift away from traditional yes/no terminology in WordPress 6.7. Older tutorials that assume only yes and no can therefore give incomplete or outdated guidance.
Make ownership the decision point
The diagnostic threshold from the PageSpeed Matters guide places healthy autoload payloads commonly around 200 to 800 KB, with roughly 10 to 30 ms retrieval time, while severely bloated payloads around 20 MB may take approximately 300 to 800 ms on uncached requests. These are workload-dependent reference ranges, not universal guarantees, so reproduce them with identical PHP, database, network, and cache conditions before drawing conclusions.
| Ownership Type | Typical Request Path | Safe to Disable Autoload? | Verification Action |
|---|---|---|---|
| Core or active plugin setting | Front end and bootstrap | Usually risky | Test anonymous, logged-in, admin, cron, and REST requests |
| Theme configuration | Front end rendering | Often risky | Check templates, customizer output, and fallback behavior |
| Admin report or editor cache | Admin only | Often possible | Disable in staging and inspect admin screens and scheduled tasks |
| Plugin-owned analytics or deferred data | Plugin-specific path | Conditional | Map calls with Query Monitor and monitor repeated option queries |
| Abandoned plugin entry | No active owner | Potentially possible | Confirm uninstall status, back up the value, and test rollback |
A large option isn't automatically harmful. Preserving a frequently used value in the autoload set may be faster than forcing WordPress to issue a separate query on every request. If you change an option to non-autoloaded, document the original value, owner, reason, date, and rollback method. Re-test front end, admin, cron, and REST behavior, then watch for a rise in repeated single-option queries.
Don't delete plugin-owned rows just because the plugin is inactive. Some plugins recreate settings, retain migration markers, or depend on data that looks unused. The safe operation is an ownership-aware change with a verified backup, staging validation, and a clear reversal path.
When Cleanup Actually Helps and When It Does Not
Cleanup pays when the stored data participates in the slow workload. Revisions are relevant to editorial-heavy sites because WordPress stores normal revision history in the main posts table, while autosaves behave differently. WordPress keeps a maximum of one autosave per user for a given post, and a newer autosave replaces that user's previous autosave, so autosaves don't automatically create one permanent row every short interval. Normal revisions can still accumulate through frequent saves and automated publishing.
Other cleanup targets have distinct causes:
- Expired transients: Useful to review when plugins create persistent clutter or cache churn, but deletion doesn't replace a sound object-cache strategy.
- Orphaned metadata: Worth investigating after plugin or content removal, especially when queries repeatedly join against rows with no valid parent.
- Spam and trashed content: Operationally useful to remove, but the performance effect depends on whether those rows participate in the measured query path.
- Table optimization: Relevant after substantial deletion or storage fragmentation, not a universal response to every slow page.
Persistent object caching addresses a different problem. It can reduce repeated trips from the web server to the database, while database cleanup reduces unwanted stored records or request-time payloads. Server-side page caching can hide both improvements during anonymous tests, so compare cold-cache and warm-cache behavior and include dynamic requests.
A smaller database isn't necessarily a faster website.
If the slow trace points to uncached PHP, a remote API, a theme query, or missing object caching, row deletion is the wrong intervention. If the trace shows a large autoload payload, expensive meta scans, or accumulated records in the exact table being queried, cleanup may help. Schedule maintenance from that evidence rather than from a fixed weekly ritual.
Configuring WP-Optimize Without Schedule Theater
WP-Optimize works best as a controlled execution tool, not as a source of diagnoses. Choose tasks only after measurements show that unwanted rows or oversized payloads affect a real request path. Turn off features that duplicate host backups, page caching, object-cache purges, or managed database maintenance.
Start with reversible actions and a restore path. Revisions, autosaves, trashed posts, spam comments, expired transients, and orphaned metadata may be suitable targets, but their value depends on what the site generates and queries. Preserve enough revisions for editorial recovery, and test cleanup on staging before touching production. WordPress's official revision guidance supports retaining useful history while limiting unnecessary copies.
Give table operations their own decision
WP-Optimize can remove selected records, but OPTIMIZE TABLE deserves separate approval. After substantial deletion, it may reclaim space or address fragmentation. It can also create load or locking concerns, depending on the storage engine, table size, hosting setup, and concurrent traffic. Check whether the host already performs this work, then use a low-traffic maintenance window if the measured case justifies it.
Configure the plugin around ownership and evidence:
- Cleanup schedule: Schedule weekly work only if the site regularly creates expired or unwanted data. A quieter site may need less frequent runs.
- Table optimization: Use a low-traffic window only when table behavior or measurements support it. A checkbox is not a reason.
- Destructive actions: Require a verified backup, a staging rehearsal where possible, and a written rollback procedure.
- Overlapping maintenance: Disable tasks that repeat host-level backups, object-cache purges, or managed database routines.
- Query changes: Handle indexes through a measured MySQL workflow. WP-Optimize does not replace
EXPLAIN, workload testing, or query ownership analysis.
Keep the schedule accountable. Record what each task removes, which request path it is expected to improve, and the metric that should change. A cleanup run that lowers row counts but leaves SQL time, dynamic TTFB, and checkout behavior unchanged has not solved the performance problem.
WP-Optimize cannot rewrite a poor query, provide persistent object caching, repair a slow remote API, or guarantee better Core Web Vitals. Use it for targeted housekeeping, then validate whether that housekeeping changes the work performed during real requests.
A one-click schedule is appropriate only when the owner understands its deletions, recovery process, overlap with other maintenance, and success measure. Otherwise, automation produces activity without accountability.
Validating Changes With Cold-Cache and Concurrency Tests
Every database change needs an acceptance test. Rebuild the baseline under the same PHP version, MySQL or MariaDB version, network path, dataset, cache state, and request mix. If those variables change together, you won't know whether an index, cleanup task, server update, or cache hit produced the result.
Run cold-cache tests first, then warm-cache tests. Capture p50 and p95 TTFB, total SQL time, query count, autoload bytes, PHP memory, error rates, and write-operation latency. Add concurrency for paths that support logins, search, publishing, orders, or other dynamic behavior. Anonymous warm-cache traffic is useful, but it cannot stand in for the requests that bypass page caching.
Watch the write path
A new index can make a read query look better while increasing the cost of writes. Compare insert, update, and delete behavior before and after the change. Review lock waits and InnoDB row-operation statistics where your environment exposes them, and inspect slow-query logs for new write-side entries.
The same principle applies to autoload changes. A lower byte count isn't enough. Check whether WordPress now issues repeated option queries, whether admin screens still work, and whether cron or REST requests lost required settings. If the page becomes faster for one anonymous route but slower for logged-in users, the change isn't ready.
Use a compact checklist for repeatable reviews:
- Back up the database: Verify that the backup can be restored.
- Record the environment: Note application, PHP, database, cache, and dataset conditions.
- Capture cold-cache TTFB: Test representative page types without a primed page cache.
- Capture warm-cache TTFB: Measure repeat anonymous requests separately.
- Profile SQL: Use Query Monitor, a PHP tracing agent, and slow-query logs.
- Record p50 and p95: Keep latency distributions, not just a best-case load.
- Measure query count and SQL time: Include the request paths that matter commercially.
- Inventory autoload bytes: Identify ownership before changing an option.
- Inspect query plans: Run
EXPLAINon recurring statements and refresh statistics when needed. - Change one variable: Avoid combining cleanup, indexes, plugin changes, and caching adjustments.
- Test concurrency and writes: Check lock waits, write latency, and background jobs.
- Document the rollback: Keep the original values, SQL, plugin owner, and restoration steps.
A green Lighthouse score from one cached request isn't a database acceptance test.
Database work moves Core Web Vitals when database execution contributes materially to the critical request path. That can happen through expensive uncached queries, oversized autoloaded data, slow PHP caused by repeated database calls, or dynamic requests that page caching doesn't cover. It won't move those metrics when the dominant delay comes from a remote service, render-blocking assets, server capacity, or a theme bottleneck unrelated to stored data.
Persistent caching still belongs in the comparison. The practical relationship between database work and mobile response time is covered in this guide to modern caching solutions for rapid mobile performance. Test caching and database changes separately so you can identify which layer improved the request.
Use WP-Optimize when measured cleanup is the right intervention. Use MySQL profiling when the query plan is the problem. Use object caching when repeated database trips dominate. The reliable answer to database optimization in WordPress isn't a weekly button press. It's a documented loop of measurement, ownership, controlled change, and validation.
If your WordPress site needs that workflow applied safely, SteamGears offers practical guidance on database cleanup, caching, lean plugin stacks, and mobile performance rather than one-click promises. Review the relevant setup resources and visit SteamGears to choose the next measured improvement for your site.
Drafted with Outrank app
Leave a Reply